
01
SolPayPlus
Decentralised cross-border payments on Solana.
Hackathon winner
Solana · Web3
I build the ground other engineers stand on: Kubernetes, pipelines and the metal underneath.
I migrated 100+ services from Docker Swarm to Kubernetes.
Provisioned with Kubespray. Networked with Calico and Cilium.
I maintain 100+ GitLab CI/CD pipelines that ship 5+ deployments every day.
Jenkins CI/CD for .NET and Angular, and the AWS underneath: RDS, S3, IAM and bastion hosts.
One place to follow a failure from the request that broke to the hop that broke it.
Engineers juggle separate tools for metrics, logs, traces, containers, Kubernetes, API tests and incidents. Every switch costs context, and every tool pages on its own. DevOptic unifies them and correlates related failures into one actionable incident.
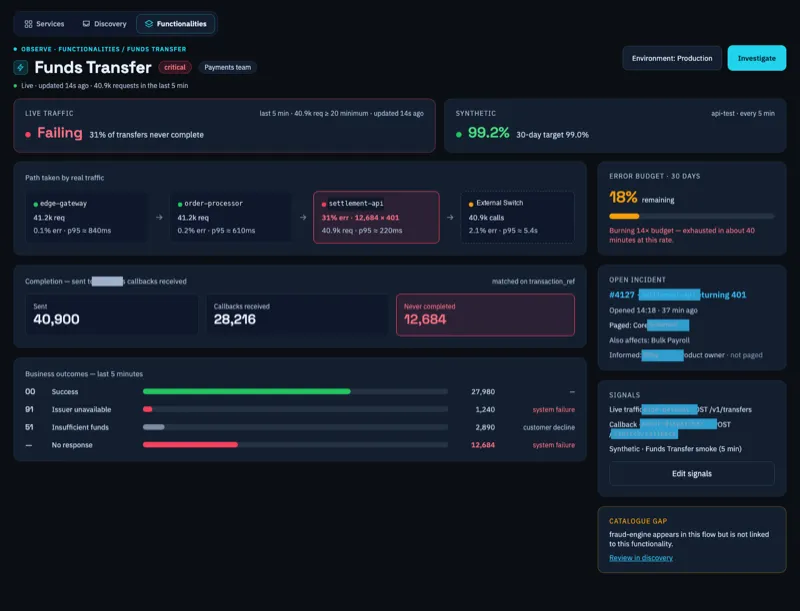
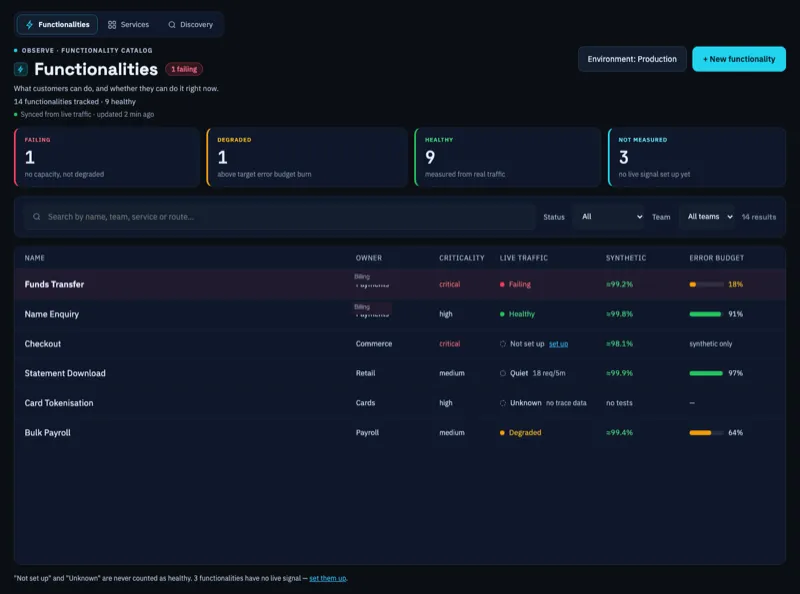
DevOptic measures business flows from live traffic. Checkout is failing: 31% of orders never complete.
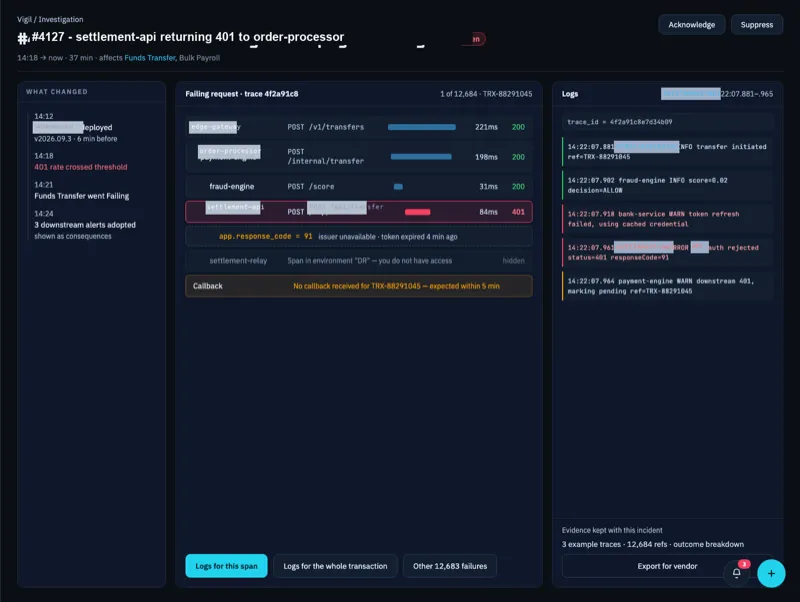
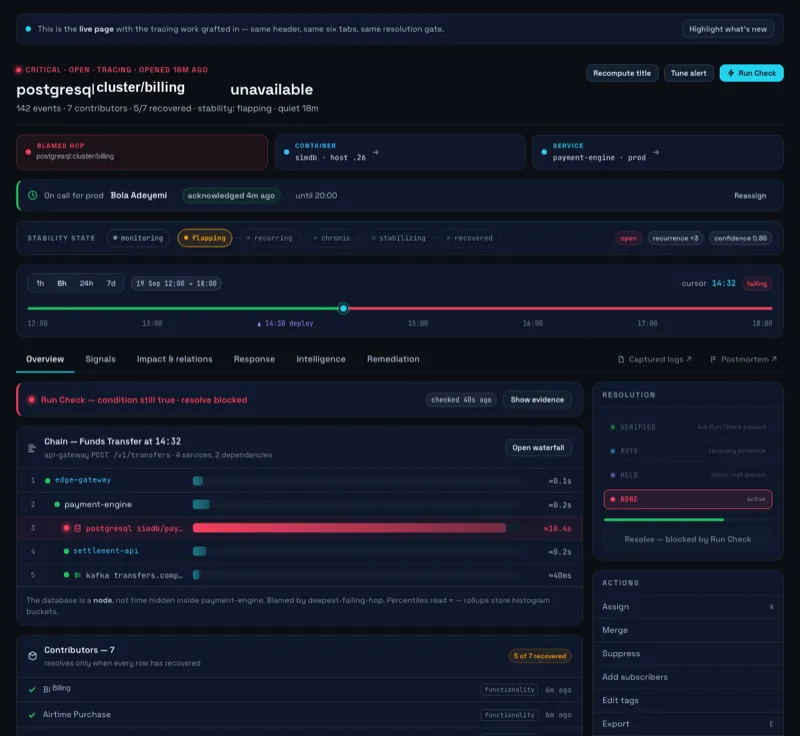
Every hop, its timing and its status, from the gateway down to the call that returned 401.
Blame goes to the deepest failing hop, next to its logs and the deploy that landed six minutes before.
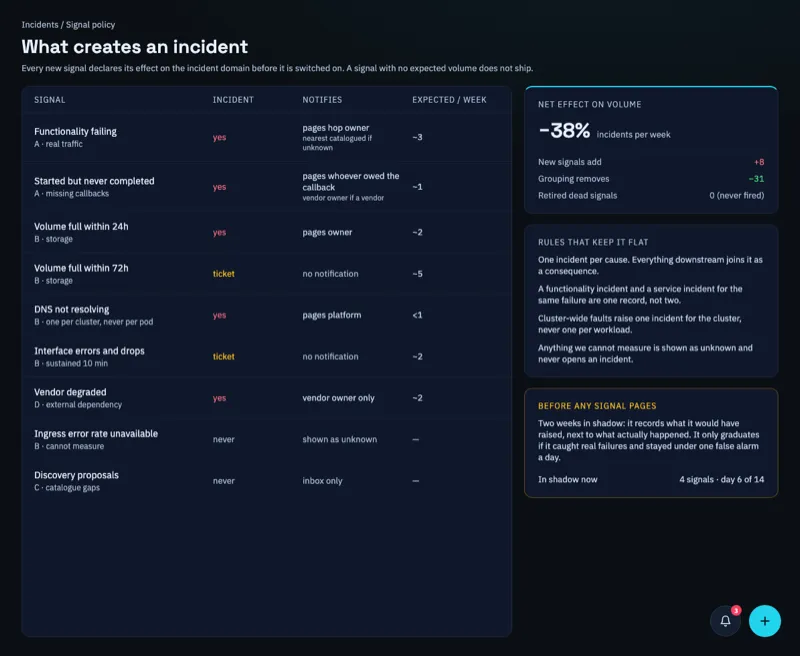
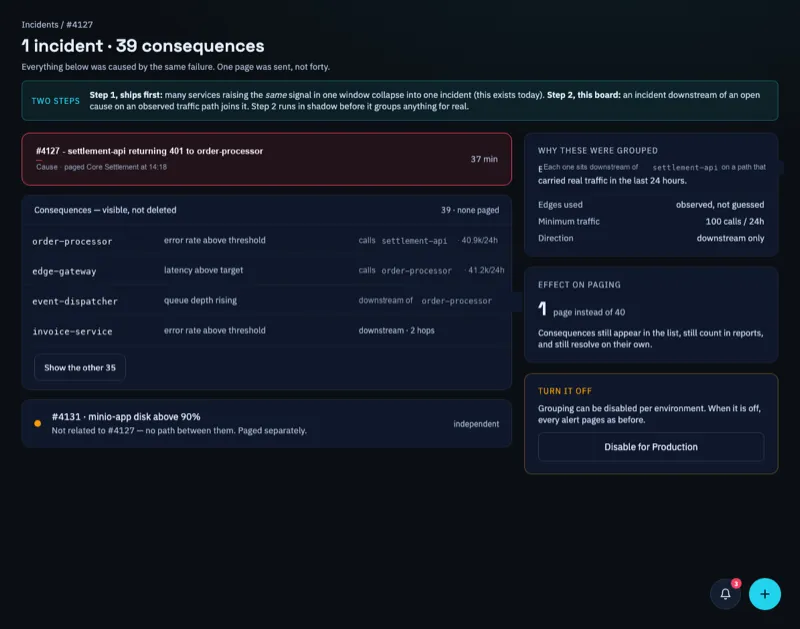
Every alert caused by the same failure joins one incident. Resolve stays blocked until a live check passes.
DevOptic understands service topologies. It correlates downstream consequences to the deepest failing hop, pages on-call once for the root cause, and suppresses downstream alert noise.
DevOptic’s Vigil engine links spans directly to ClickHouse logs. Clicking any failing span immediately loads the container logs, stack trace, and environment context at that exact millisecond.
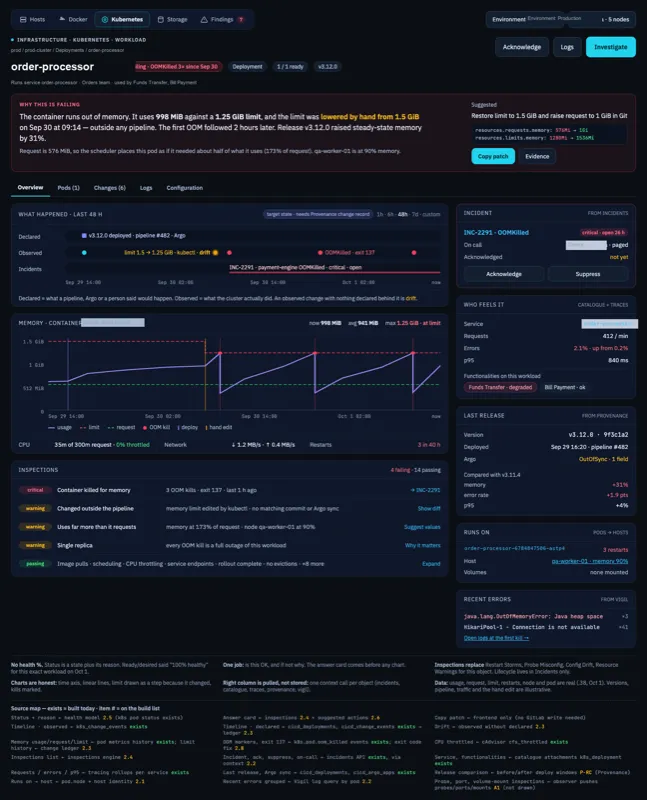
Every failing service in DevOptic automatically surfaces its deployment provenance: exact Git commit SHA, pipeline number, author, and how many minutes before the incident it landed.
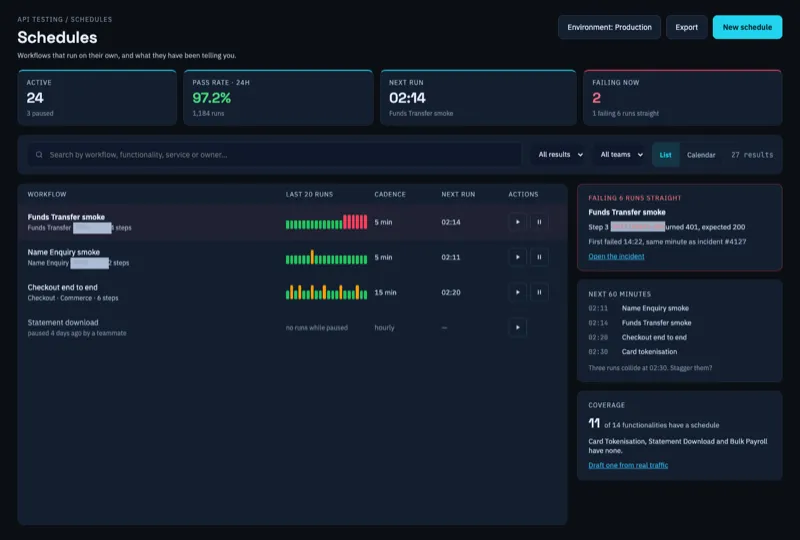
DevOptic measures actual business journeys directly from live HTTP traffic and synthetic contract probes. When checkout conversion drops, an incident is triggered before users file tickets.
Because DevOptic runs against production cluster topologies, there is no public staging sandbox. I walk through live architectures, triage mechanics, and production code 1-on-1.
The “active cluster” flag now only decides what the UI shows. Bootstrap starts a workload-readiness watcher, a metric watcher and an alert service for every connected cluster, so all of them raise incidents at the same time.
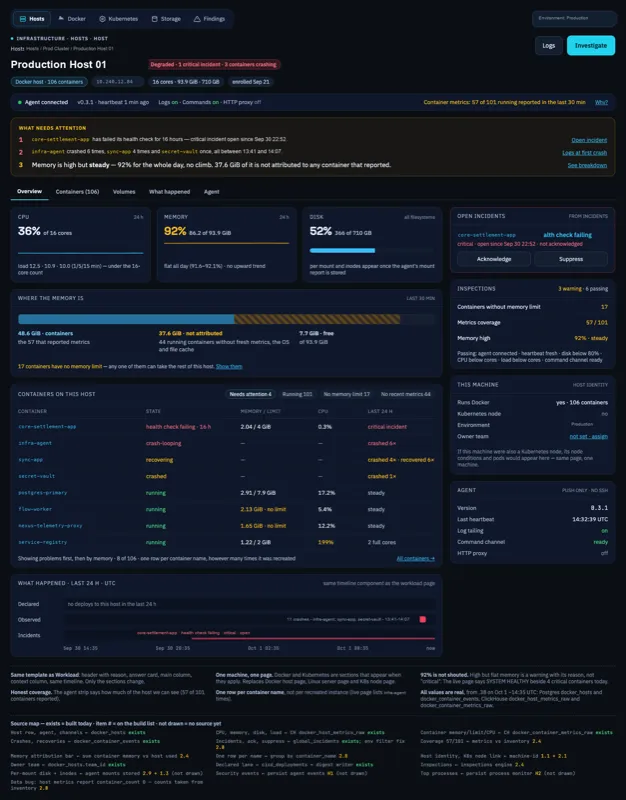
Fingerprints use stable names: compose service, then container name, service name, then host plus image. Pods use namespace and pod name, and UUID or hex IDs are rejected outright. A relapse within seven days reopens the same recurring issue. After that, a new one opens and links back to the old.
The real policies were plain literals and alternations that never needed a regex engine. Those shapes now match with allocation-free substring scans (7,380 → 389 ns/op, ~19×), and anything else falls back to regex. The next profile pointed at the credential-redaction pre-filter, now a single pass (1,147 → 379 ns/op, ~3×). A differential test proves it never misses a secret the old version caught.
Testing against a live fleet showed the resolver matched zero containers: it filtered on Docker’s human-readable status (“Up 2 minutes”) instead of its state (“running”). I fixed the filter, validated it end to end on a real host, and added logging so a silent zero-match is visible next time.
Decentralised cross-border payments on Solana.
Each layer, the tools I run on it, and where I ran them.
Ask me about migrating 100+ microservices to bare-metal Kubernetes, cutting incident MTTR with DevOptic, or open Senior/Staff platform infrastructure roles.